Di-Dash is the first of its kind data visualization tool designed to track, monitor and display data from any source onto any diagram of your choosing.
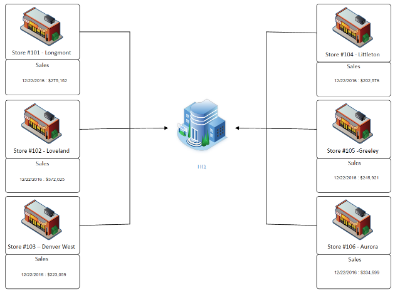
Flows gather data from any source and store them in the Di-Dash repository. This data is then available to custom diagrams created by you. No more boring charts and graphs that can't capture real-life scenarios.
You can finally show data moving throughout your organization or application as it actually exists. Additionally, you can write rules that analyze your data in near real time and can alert your team to issues via email, by opening a ticket, etc.
This video provides a quick overview of Di-Dash.
(Go to full screen for the best effect)
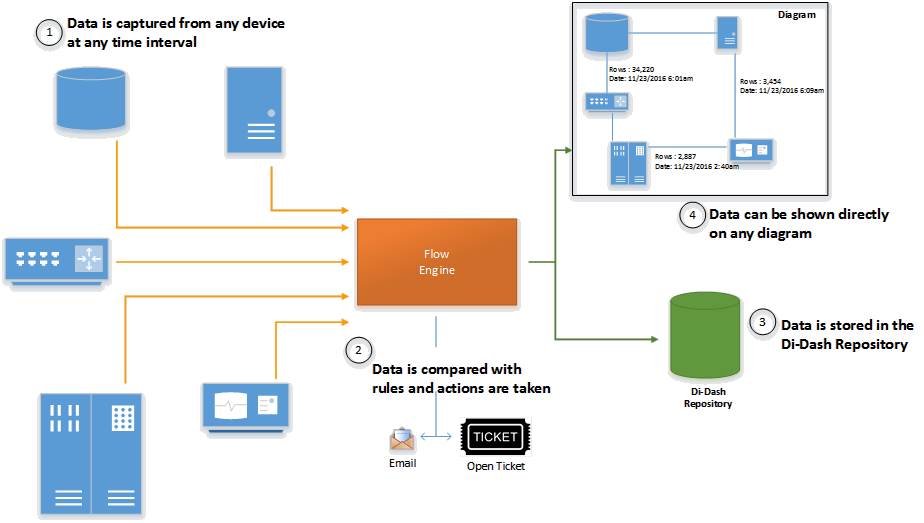
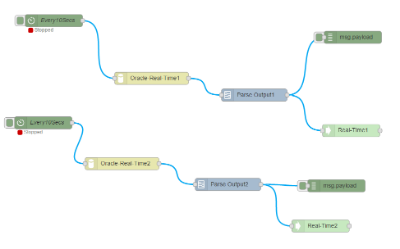
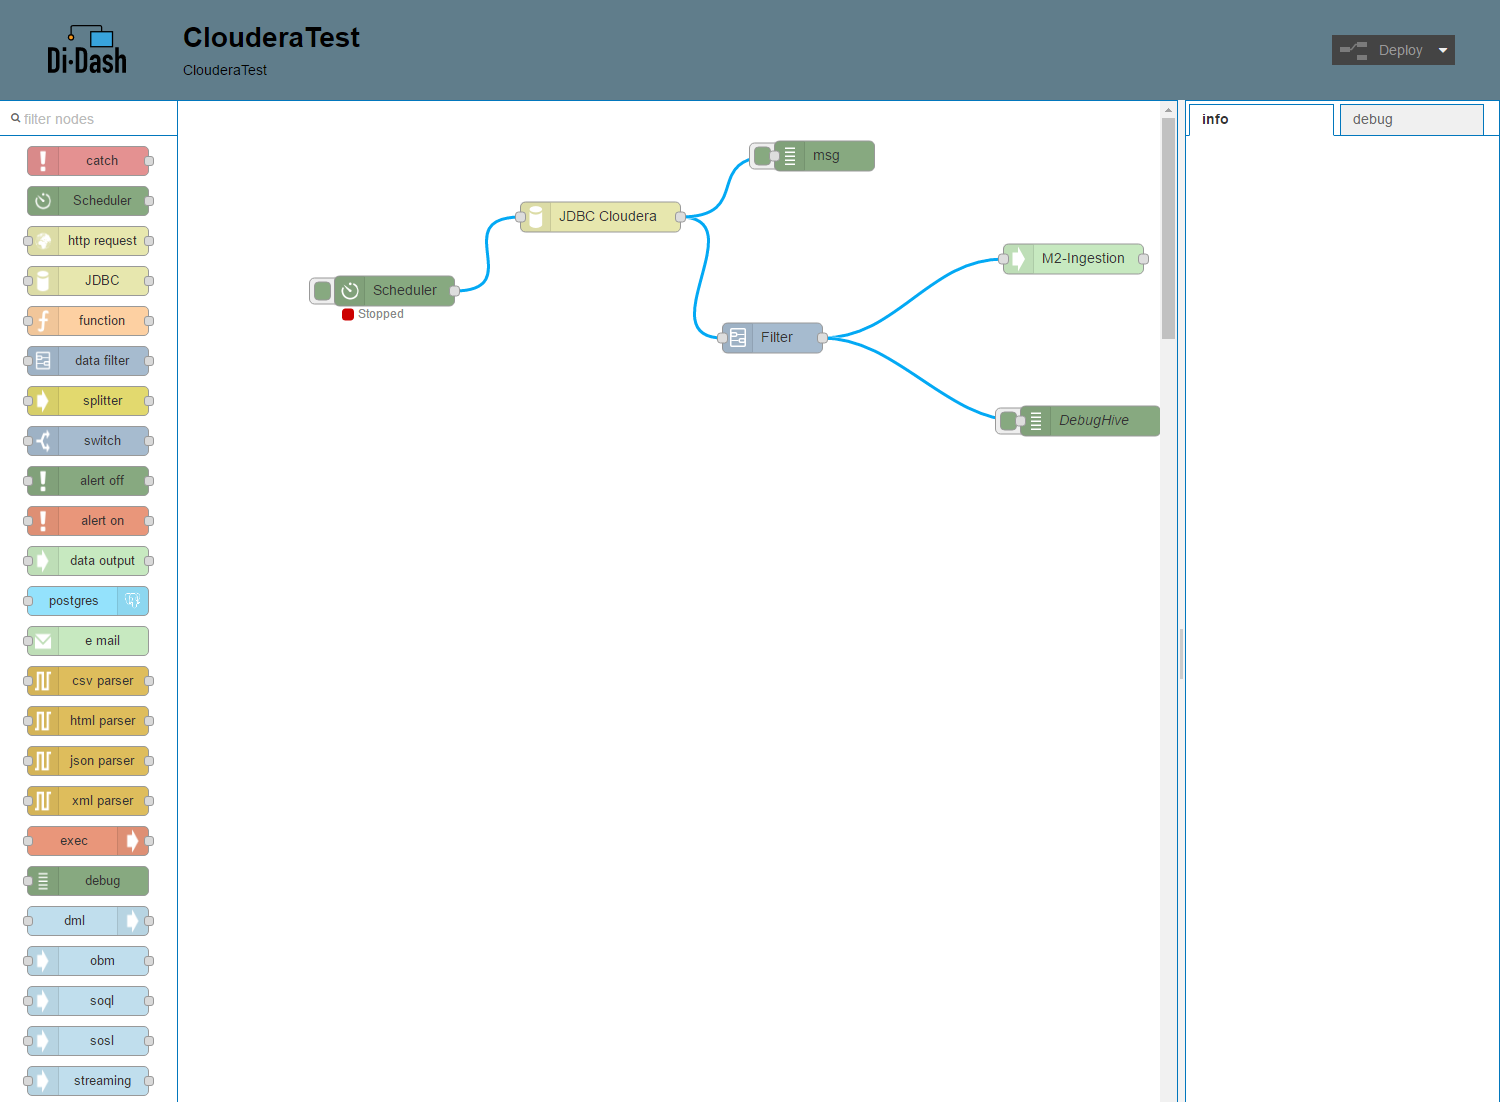
Flows capture data from any source and send it into the flow engine.
Custom rules are created to monitor the data and alert when the incoming data doesn't meet business rules. Responses can be email or opening a ticket.
Di-Dash includes a robust data repository so you can build graphs and look back on previous data.
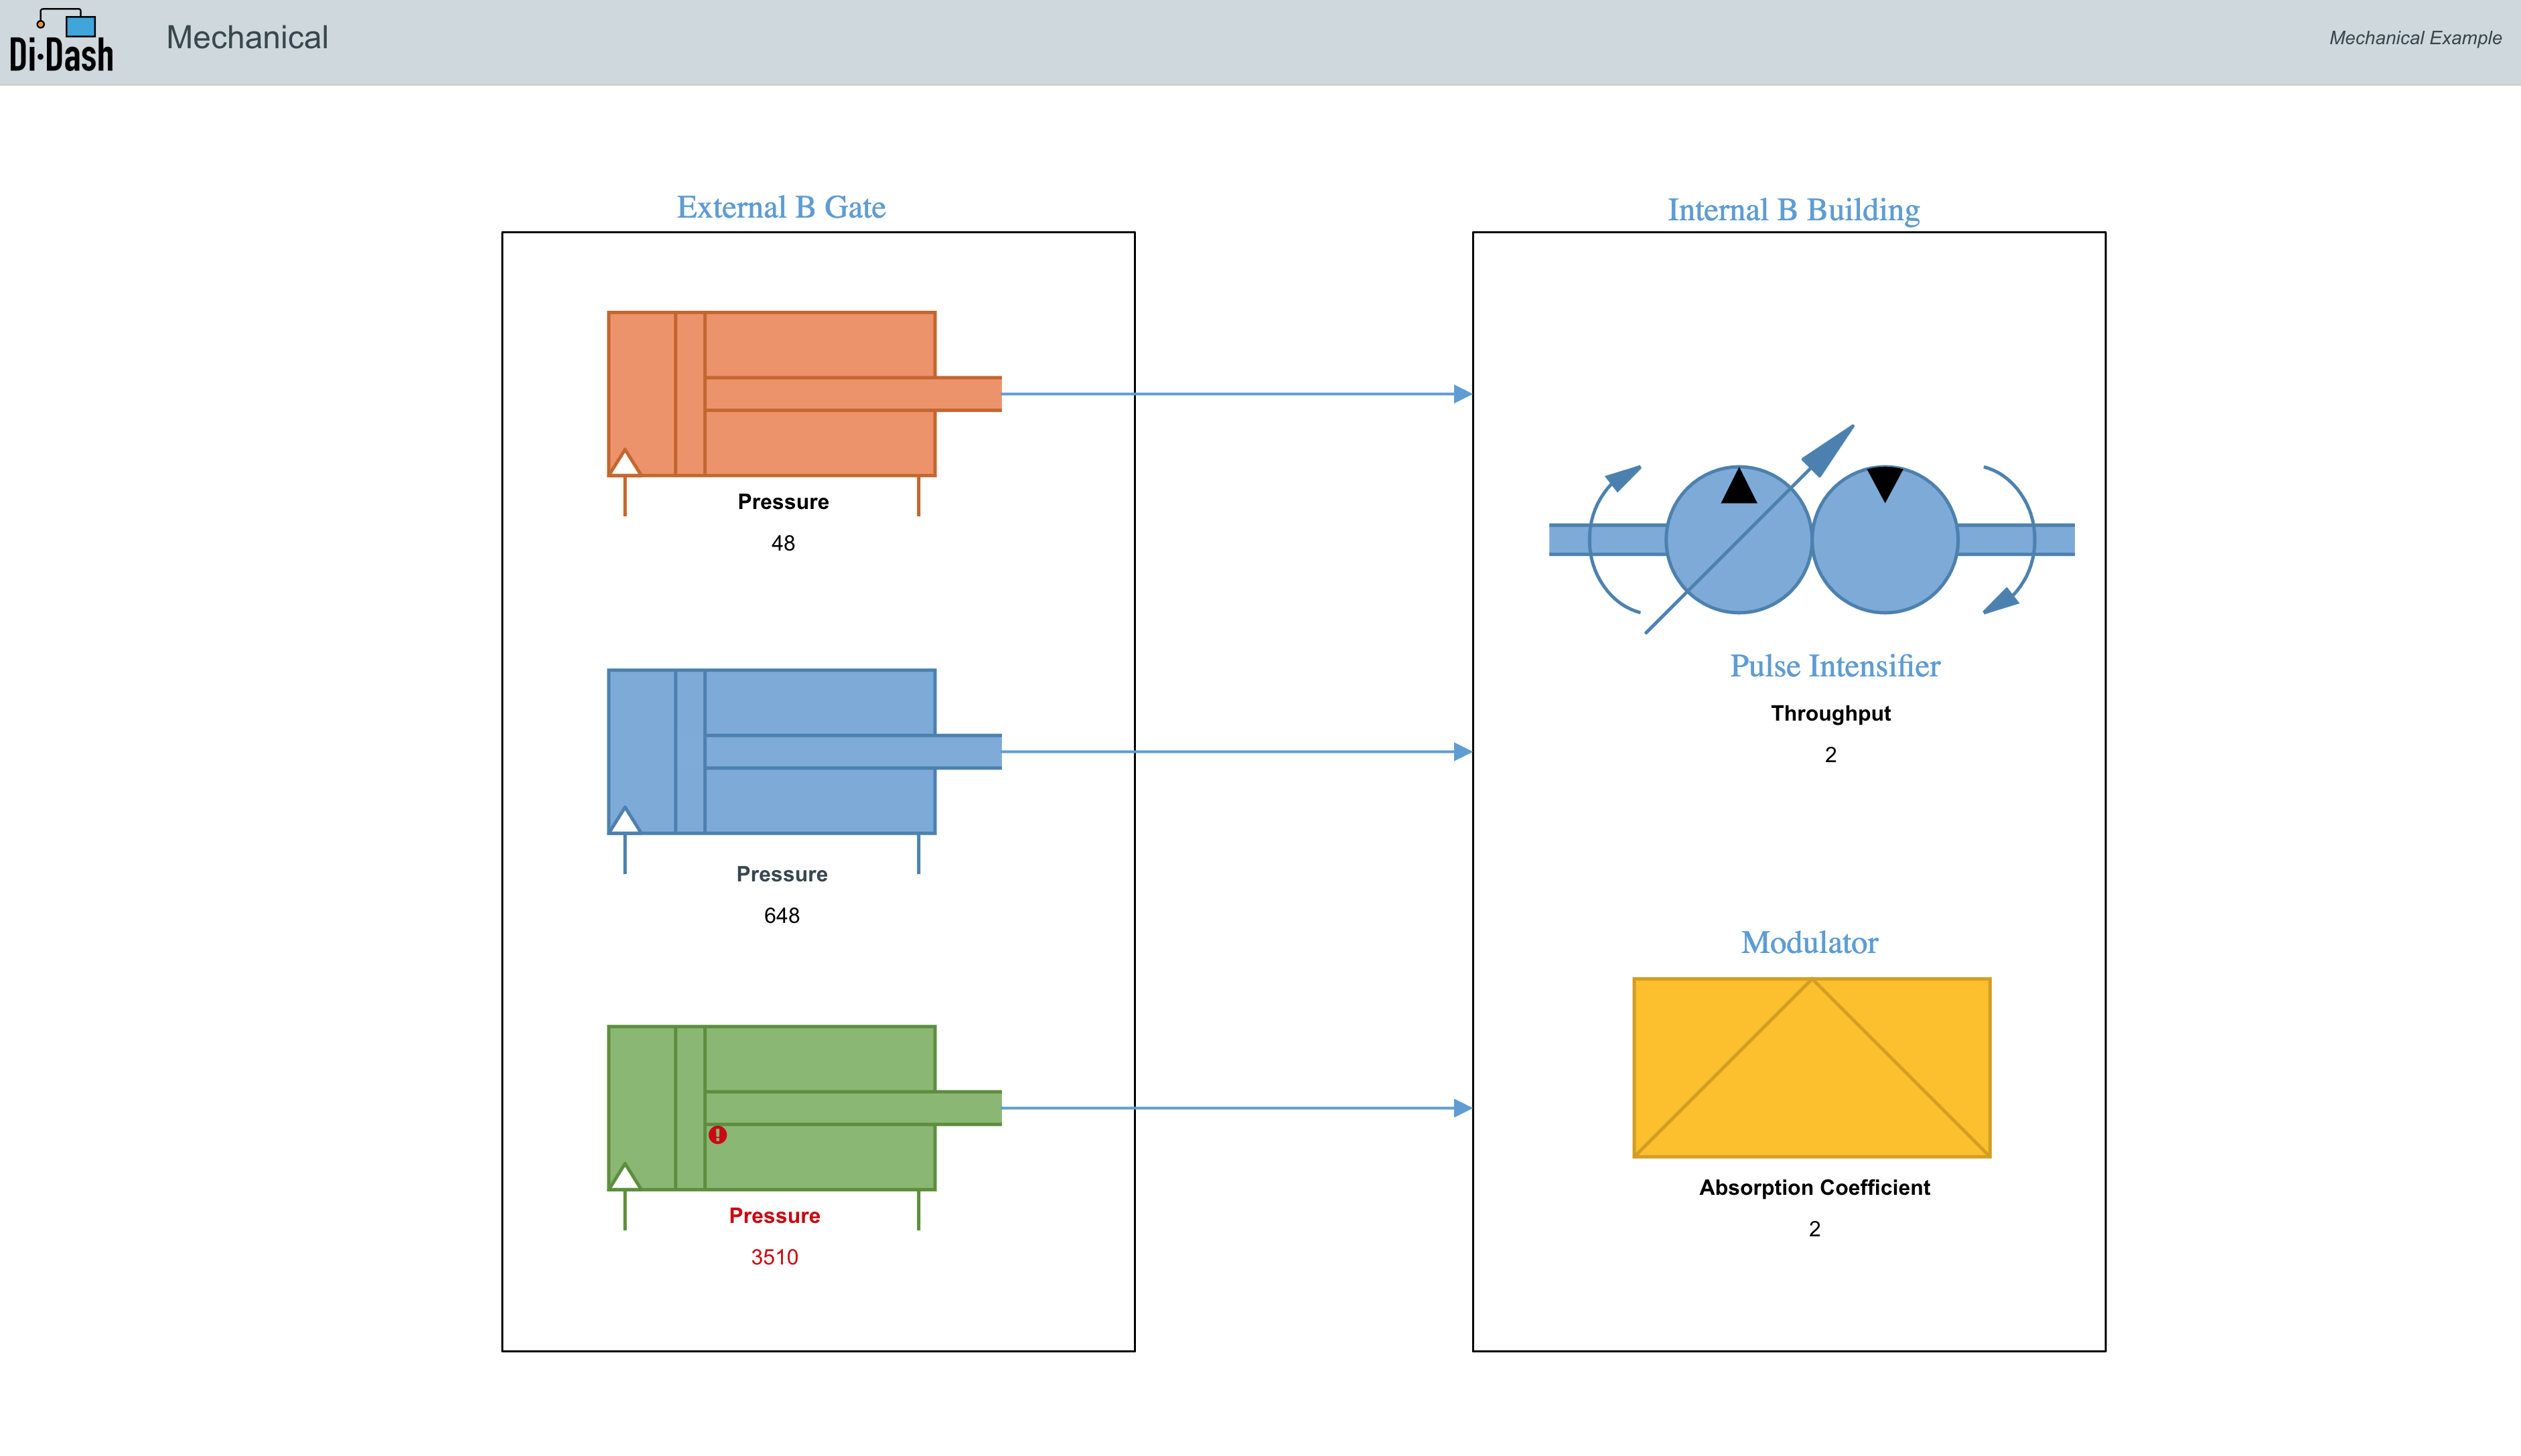
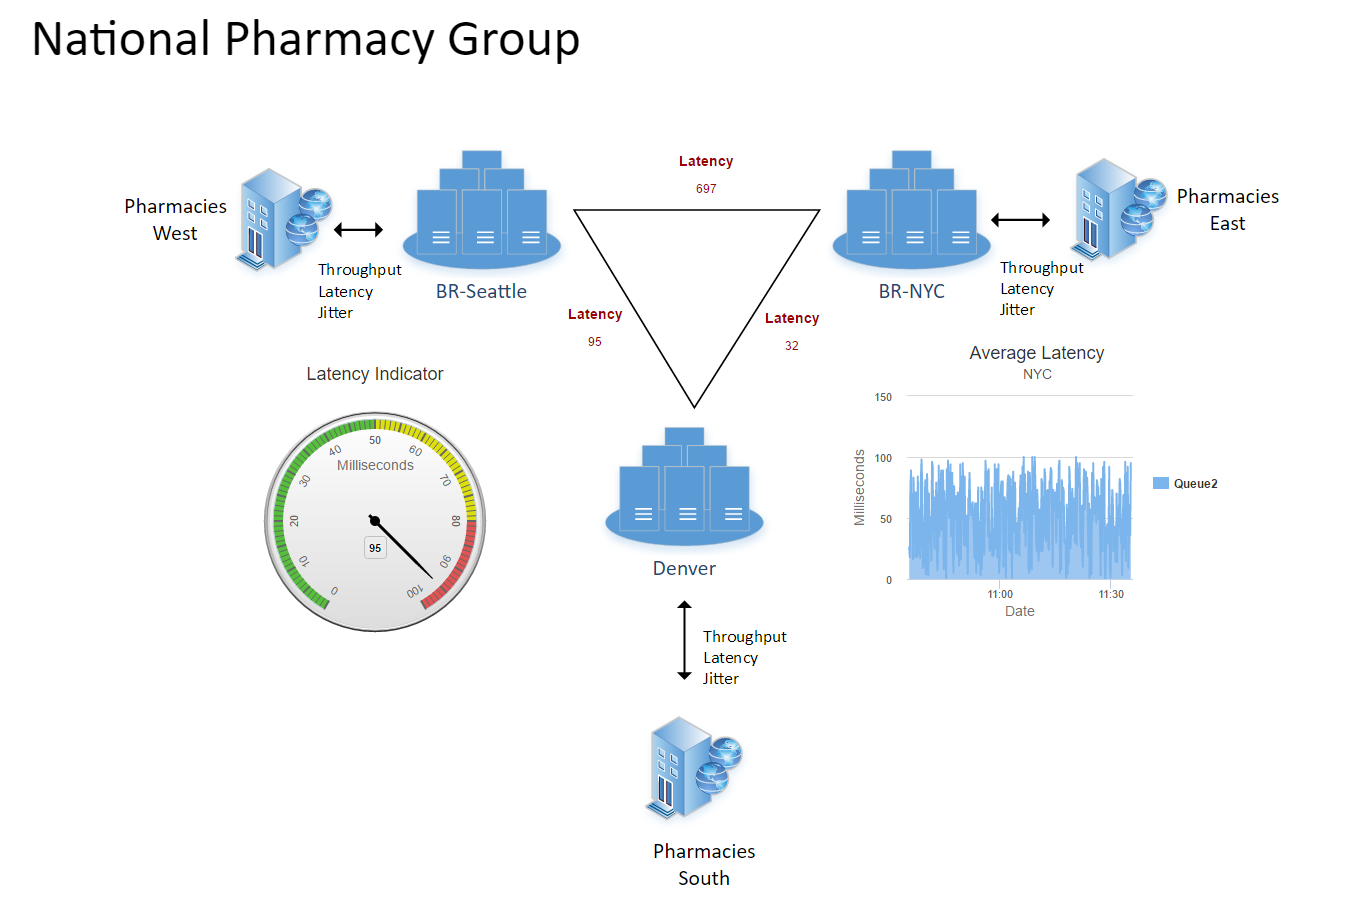
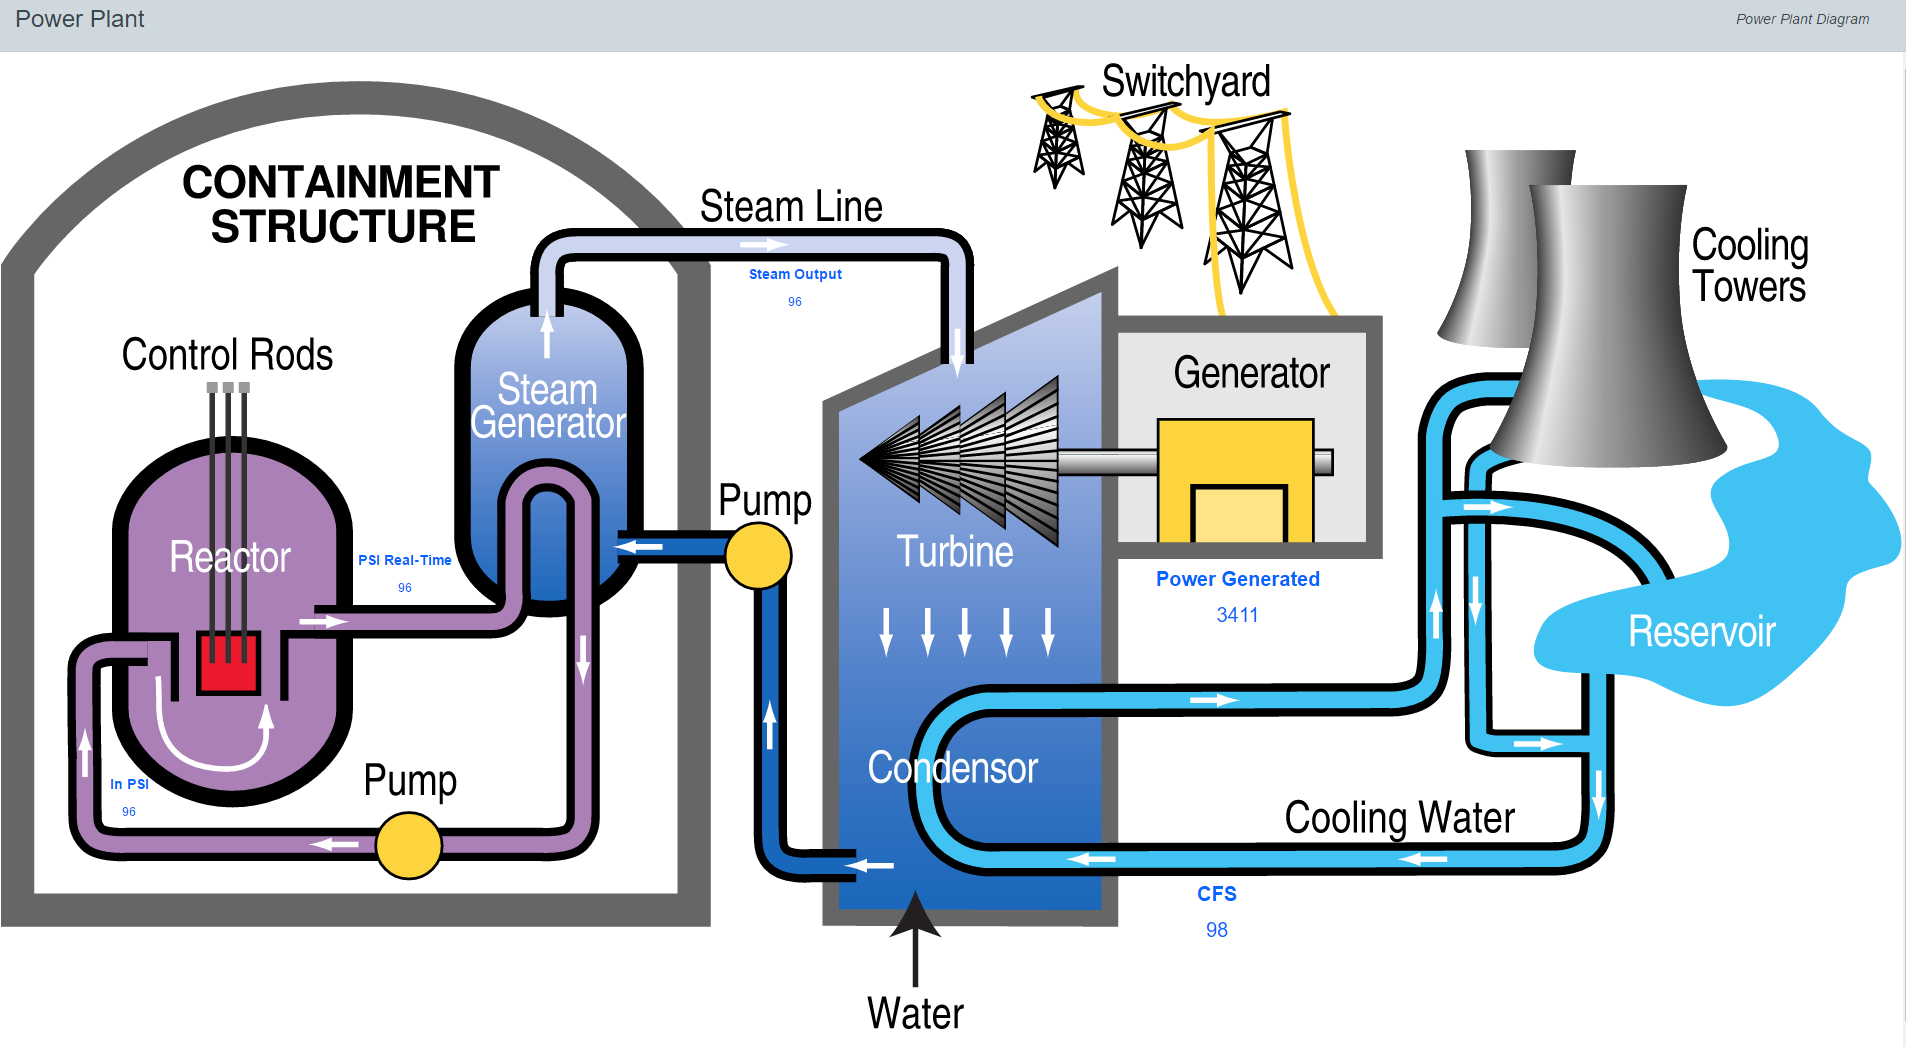
Diagrams are created by you to match any business process. Data is displayed in real-time as often as you like.
This video provides a quick overview of the Di-Dash application.
In this example, we show how easy it is to monitor patient rooms within a hospital wing. We'll show you how to set up flows and place data elements onto a diagram.
Request an invite to our ongoing private beta!